

ETF: GLD 20240315
paolomoneti.substack.com

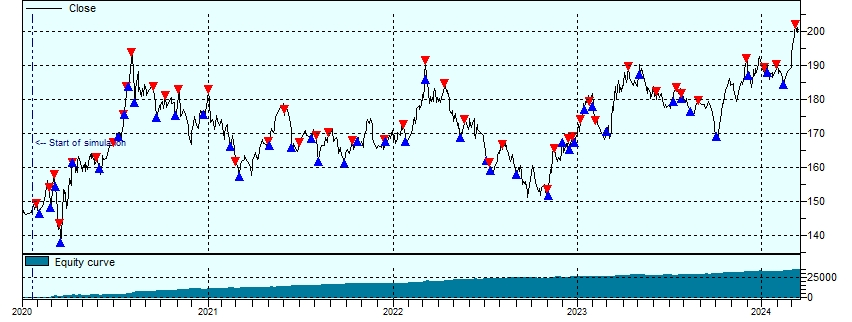
Y-Axis is GLD Price in Dollars, X-Axis is Time.
The model provided a "Short" signal on 20240308 and filled on 20240311 @ $202.00
The graph includes the training data 2020-2022 as well as the validation data 2023-